Craig Release Latest News
This 2019 summer was quite active, and I am happy to share lots of interesting news regarding the current and future punch releases.
Before We Start
Maybe you are not familiar yet with the punch. Here is a quick recap.
The punch is a ready-to-go-production data analytics solution. It is built on a foundation of key open source technologies such as elasticsearch, spark and kafka, all packaged together with a number of business modules in a single well-documented and supported distribution.
The punch is unique in that it lets users design so-called data processing pipelines by configuration. These pipelines cover a wide range of functional use cases : data collection and transport from edge to central platforms, data parsing, filtering and enrichment, real-time alerting, or machine learning. Combined with cutting edge data visualisation capabilities, multi-tenancy and security, the punch lets you go production today, on cloud or on premise infrastructures.
Cybersecurity, system or application monitoring, predictive analysis are typical punch sweet spots. It can serve virtually all types of business verticals: retail, healthcare, manufacturing, financial services, government.
The punch is now 5 years old, its current stable and major release is called Craig and already equips four Thales production systems. Two of them are cybersecurity platforms. The punch team has more than 5 years of experience with platform upgrade and maintenance. It is now a smooth process and in turn one of the key punchplatform value: making sure each production system is upgraded yearly to stay up to date and secure.
Interestingly one of the newly deployed punch is running on Amazon. Deploying a punch on premise or on cloud is straightforward. The punch deployer (one of the punch feature) keeps on improving and now includes additional services such as the security or alerting elastic plugins, logstash and more. All in all, these modules boosted the punch functional capabilities. It really goes quickly to identify the customer use case(s), to define the right punch architecture together with the required modules, and deploy everything. All that takes days, not weeks or months.
For more details, do not hesitate visiting https://doc.punchplatform.com. We keep the documentation quite complete. You can also try a punch on your own, it runs fine on any mac or linux laptop, and not only on giant production clusters.
And now some news !
Customer Services
We are quite happy to offer a patch and security service to our customers. This service makes our customers know upfront if some of the punch components suffer from a vulnerability. And if so, we provide them with useful analysis, mitigation strategies and, of course, patches.
Alerting
The punch now ships with the amazon alerting plugin. It comes in addition to the punch complex event processing rules, and offer a completely integrated solution to define various alerts on top of Elasticsearch data. Check it out !
Security
We also included the amazon security plugin. It lets our clients to protect both the external data accesses and the internal platform traffic from/to Elasticsearch.

Of course, securing a platform goes beyond deploying a plugin. Although excellent that plugin is far to do the job alone. All punch services interacting with Elasticsearch are now secured: Storm|Spark|Administrative|Monitoring services, everything can be provided with the required credentials. This important work is now complete, and basically means you can safely deploy a punch in cloud environments without compromising your security. Check out the punch security getting started.
If you are not familiar with the amazon opendistro initiative, read this blog.
Machine Learning
The punch machine learning stack keeps on improving. Our goal and vision are simple: make the punch the simplest and easiest production-ready platform for deploying machine learning pipelines on the market.
Machine Learning for Data Scientists
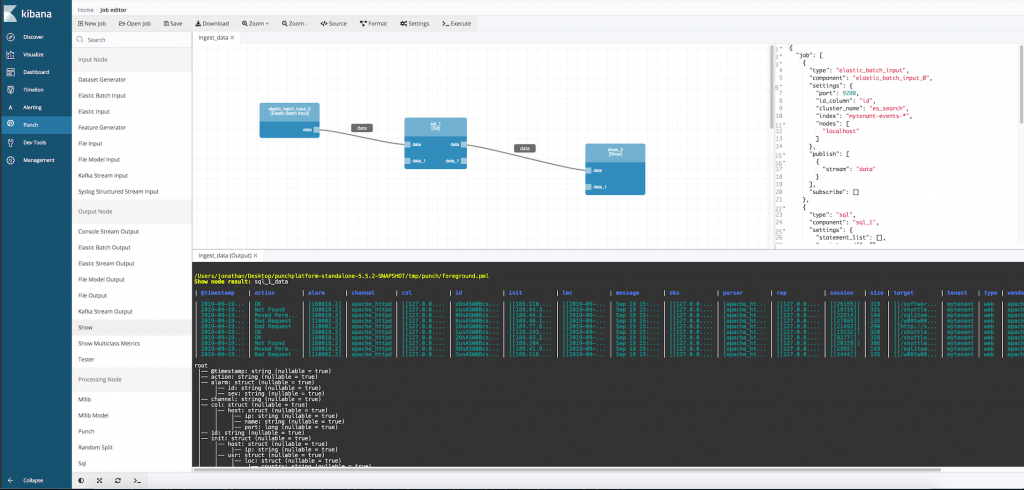
For many reasons, the punch is now used in all Thales French labs. It is lightweight, easy to install, well documented, and it provides access to production data. Its machine learning toolkit allows data scientists to deliver machine learning pipelines under the form of simple configuration files. That is a killer feature as it makes it easy to test or deploy these pipelines on production sites. There is also a pipeline editor. It looks like this:
But two important capabilities were still missing. The first is simply python. The second is about scheduling and explained later in this blog.
Python is not the easiest technology to deal with in production systems. Nor does it provide scalable algorithms such as the ones you find in the spark/java ecosystem. Yet python is key as it provides lots of additional libraries, algorithms and frameworks. In short python is the data science language of choice. We thus naturally decided to make python a first class citizen of the punch.
Here is what we did: first, pipelines can be run indifferently on three target runtime environments : spark (i.e. java), Pyspark (i.e. python) or plain python. When designing a pipeline the user will naturally pick one of the three environments. Pyspark is (extra) great. Performance are excellent, you benefit from spark distributed capabilities, and from the elegant and concise python programming model.
Spark and PySpark are also a great choice as using only SQL (i.e. SparkQL), you can express most of your data manipulation. The less you code, the better. We truly share this vision with our data scientists colleagues.
This said, even Pyspark is sometimes too heavy and some use cases are best served with plain python. Our python API lets you do that too. The punch now provides a python toolkit to write python pipeline nodes. You program your node in python, with or without adherence with spark (dataframe) APIs. If you have good reasons to stick to pure python (typically with pandas or numpy), just do that, it works as great.
These nodes can then be inserted in pipelines through the pipeline editor, and safely deployed to the platform. Here is what it looks like to code a simple ad-hoc python node:
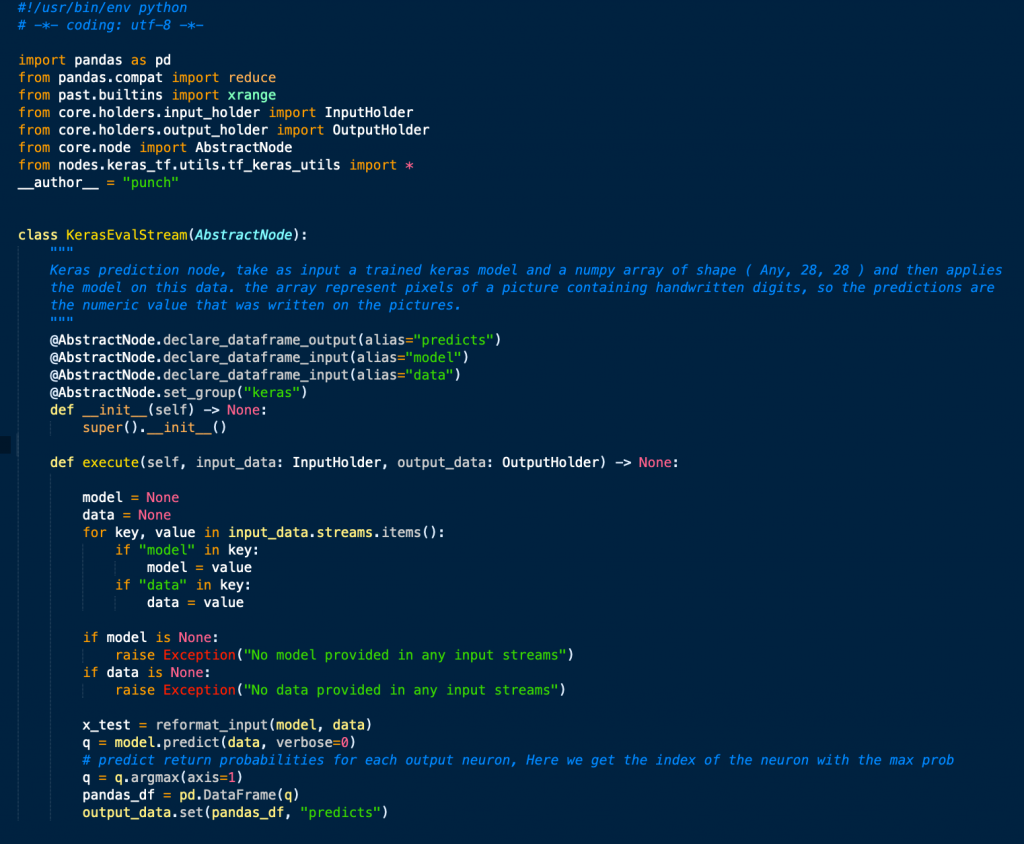
In short : welcome python !
Side Note: at a sprint demo this summer, I was looking at the same punch pipeline be executed first on spark, then pyspark. Then another one be executed on Storm. Although I know the punch in quite some good details, I was myself amazed ! Hey how can that work ? How are we going to explain that magic to users ? This is really dynamite! There are lots of good ideas and innovation behind that ! Promise we will provide the technical details shortly.
Scheduling Machine Learning Pipelines
The punch already provides a production-ready feature to periodically submit jobs. It lets you schedule arbitrary batch applications in a way fully resilient. I.e. the punch keeps track of the job progresses, and should a server failure occur, the scheduling is correctly resumed from another server. This feature is called plans. As you can guess it provides advanced templating capabilities required to generate jobs with the right properties, in turn submitted to the Spark engine.

We will use plans for the many years to come because it is extra lightweight and implemented directly on top of zookeeper and elasticsearch. No need to have a heavy or complex system such as Kubernetes, Mesos, Hadoop, etc.. to do the job. You can even use plans on small data collectors.
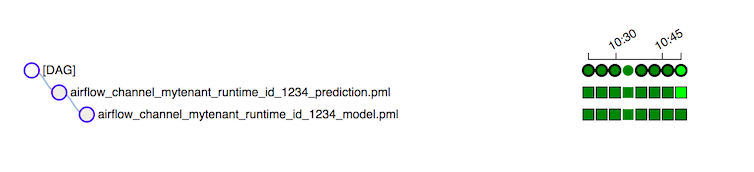
Yet we miss a richer scheduling model to express runtime dependencies between jobs. I.e. “first compute my machine learning model, then immediately use it to compute some predictions“. Hence we decided to integrate airflow to the punch. In short, you can define airflow dags as part of your channel, and the airflow runtime will take care of scheduling the pipelines the right way. This feature is still beta but will be demonstrated in various important demos this fall 2019. Here is what a punch airflow dag looks like:
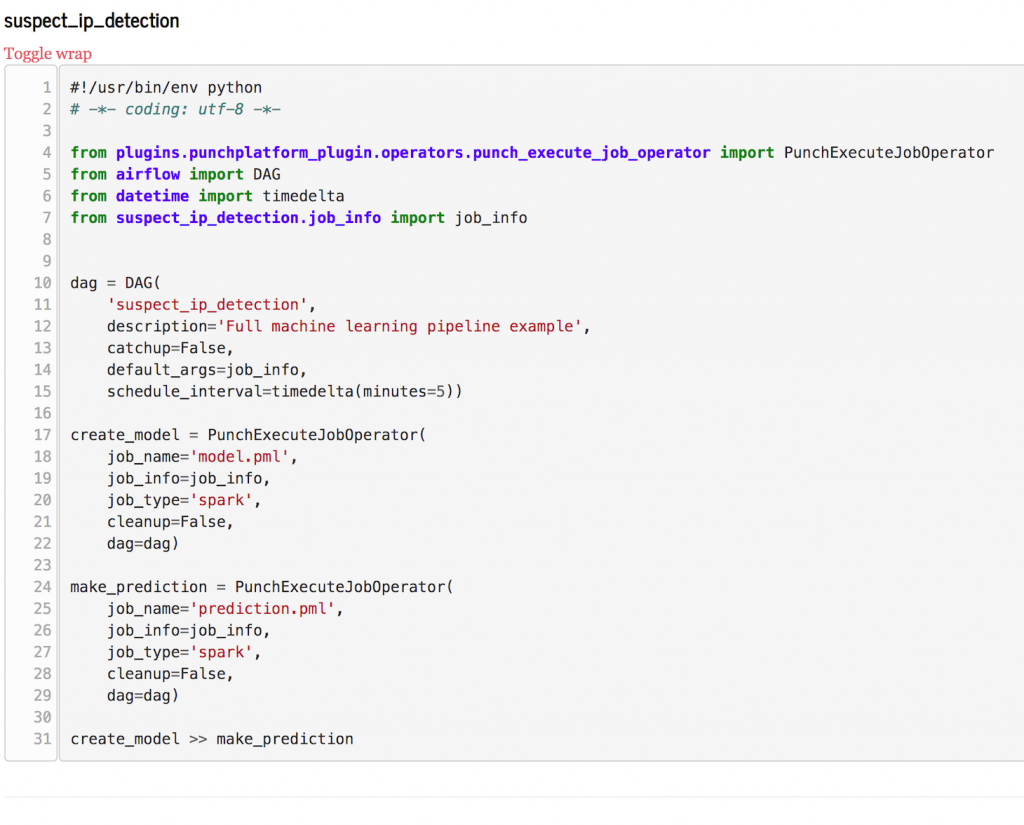 Airflow is lightweight, elegant and powerful. A perfect match for the punch. Not to mention its capabilities to define inline spark (pyspark) jobs. If you know already airflow, notice how simpler this dag looks like compared to a plain airflow dag you should write on your own. Once running you can benefit from airflow UIs and APIs to keep track of your pipeline progress.
Machine Learning for Operational Teams
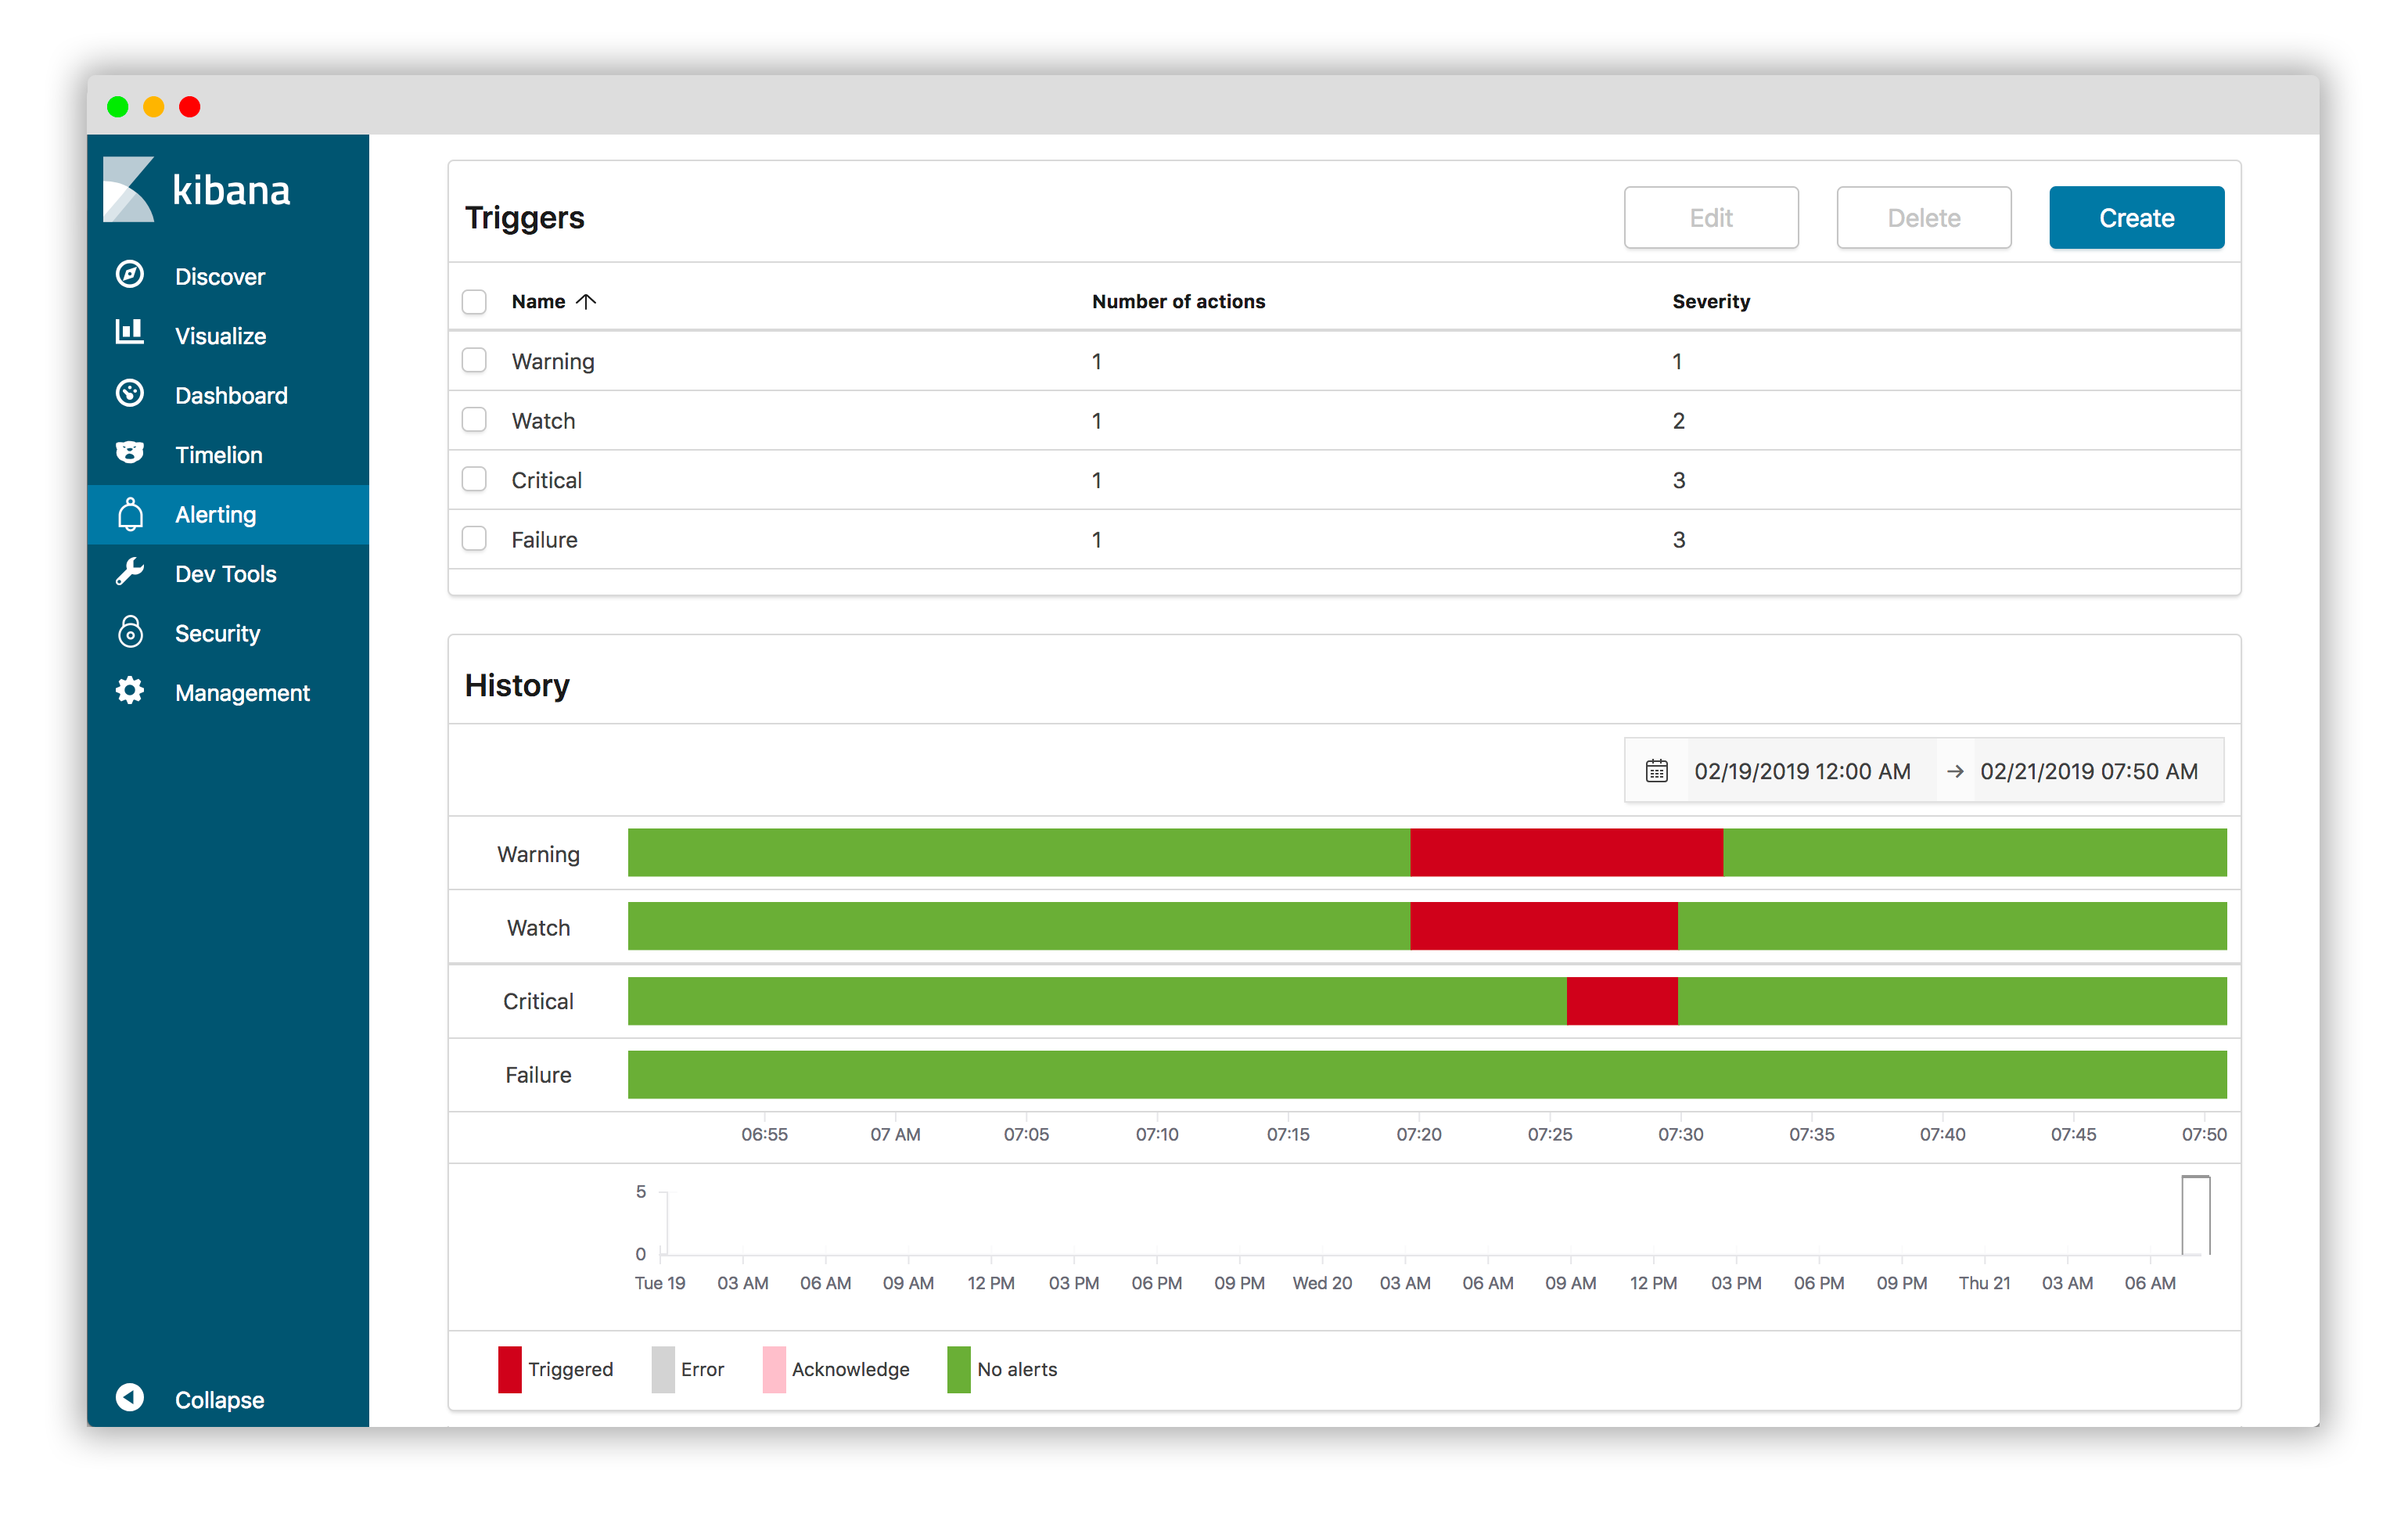
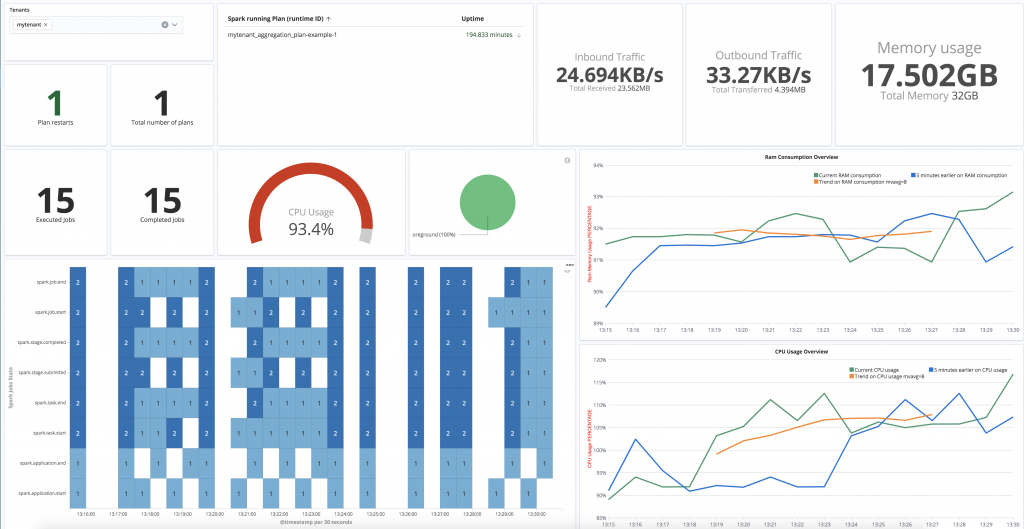
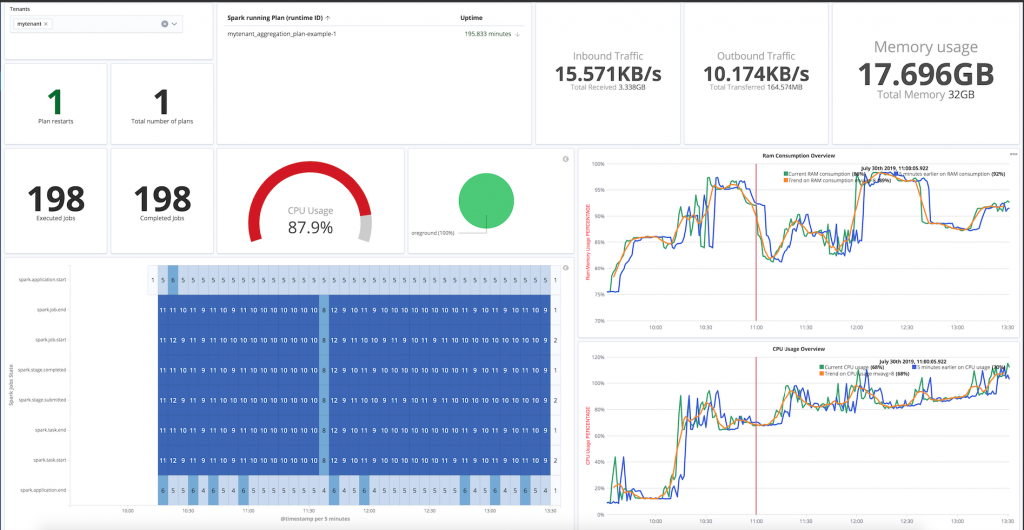
We also improved the monitoring plane so that users can easily follow the performance of their machine learning pipeline directly from integrated Kibana dashboards.
Wait: what does this mean ? why not providing the spark UI ?
The short answer is that the punch is a production-ready platform. Here is the longer answer: the punch design is particular in that we leverage Elasticsearch to monitor not only all punch components and user applications, but more globally the complete end-to-end system. The punch is used in worldwide distributed setups with collectors in Asia and receivers in France. The operational teams, in charge of running 7/7 critical services, need state-of-the-art monitoring and alerting capabilities to detect issues upfront. These teams do not and must not be familiar with the many technologies at play.
Hence the punch design : we collect lots of metrics from applicative and system components, and we treat these as logs: normalised and enriched. As a result, Kibana dashboards can be used to investigate any performance issue, and combined with the alerting plugin users can define their own custom alerts in a matter of a few clicks.
Coming back to Spark, once a machine learning (or as a matter of fact any other spark job but let us stick to machine learning for the sake of clarity) is deployed, its performance must be easy to understand and monitor. We decided that all platform users from data scientist to business analyst to ops and support teams should use Kibana and Elasticsearch to understand what is going on.
Why this design ? In order to avoid ending up with lots of various monitoring subsystems : SparkUi, Grafana (on InfluxDb,Graphite,etc…), Kibana (on Elasticsearch), Prometheus, Nagios, OpenStack/YourKubernetes/YourCloudProvider monitoring planes etc.. with system metrics on the left, applicative metrics on the right and machine learning statistics yet elsewhere. Do not do that ! choose your side and stick to it.
We decided to go with and only with Elasticsearch|Kibana. We also decided to provide trainings to all these folks so that they understand Kibana and Elasticsearch. Granted, it takes a little time. But .. I think I do not even to explain the immense and numerous benefits once you achieve that: a simpler architecture, lots of en-powered users, and a growing community of people inventing on their own lots of great use cases. Keep it simple, Keep it simple, Keep it simple !
Archiving
This is such a rich (and quite complex) topic that we will only provide the essential news.
Jointly with cybersecurity teams, we designed and implemented an archiving system capable of leveraging standard commodity servers equipped with lots of disk. The punch already leverage distributed object storage, with the many benefits associated with it (have you read this blog ? the punch is really in the right direction not to say a precursor).
Yet face it, a distributed object store has its own cost and operational complexity. We thus decided to better exploit standard local filesystems. This new architecture is sketched out here. We refer to it as high density archiving.

For more information. contact us :).
CyberSecurity Modules
We conclude this blog by some of the most important features. The punch has been chosen to build new Thales cybersecurity product lines. Our colleagues wanted to leverage Elasticsearch/Kibana in their own solutions and the punch was of course the logical asset to start from, with its many parsers, its modular architecture, and it overall maturity.
These teams quickly identified a number of additional capabilities. One is to perform live enrichment by crossing the collected data with threat intel data, in a way fully automated. These capabilities comes as additional modules you can deploy in your pipelines, as well as new punch language built-in functions. It makes it simple to enrich logs in real time, and in turn benefit from powerful and efficient search capabilities.
To get a sense of it, here are a few punch lines that will periodically reload some threat intel resource you might have.
Tuple resource = fetchJson("https://your.threat.intel/suspect_ip.json")
                 .refresh("0/60 0/1 * 1/1 * ? *")
                 .asTuple();
You then use it the way you want to enrich your logs with the many punch operators to efficiently match some of your log fields with that threat intel resource.
If you are not familiar with the punch language, just know we (punch team) use it to deliver various parsers or small functions to our users. But more and more users write these on their own.
We are now working on several variants to deal with retro-hunt capabilities. These are batch processing jobs leveraging the spark pipelines scheduled on top of Elasticsearch data. As you can guess, doing this basically require all the feature we sketched out in this blog : pipeline by configuration, spark batch jobs, Elasticsearch, and smart and resilient job scheduling. We plan to deliver this feature by the end of this (2019) year.
What’s Next?
No. I will not explain that. This blog is always too long and technical to read. Stay tuned for the next blog !
A special thanks to all thales teams from the many units (data scientists, land/air/spatial/cybersecurity/infrastructures engineers) to try the punch, to complain about it, to improve it, and to work with it. This punch story is an amazing story.
Dimi