The punch 6.2.0 (Dave) has been released and marks a significant step forward. A good time to give some punch news, what are the new features ? what is the punch used for? where will it go next?
The Punch goes AI
Deploying machine learning applications to production (and in particular to on-premise production) platforms is not as easy as many blogs explain. Here is a good one that unveils the struggle. You quickly hit issues of ML model maintenance, lifecycle, traceability, not to mention the many data access and security concerns when dealing with critical systems.
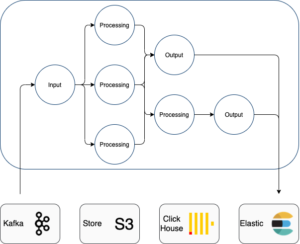
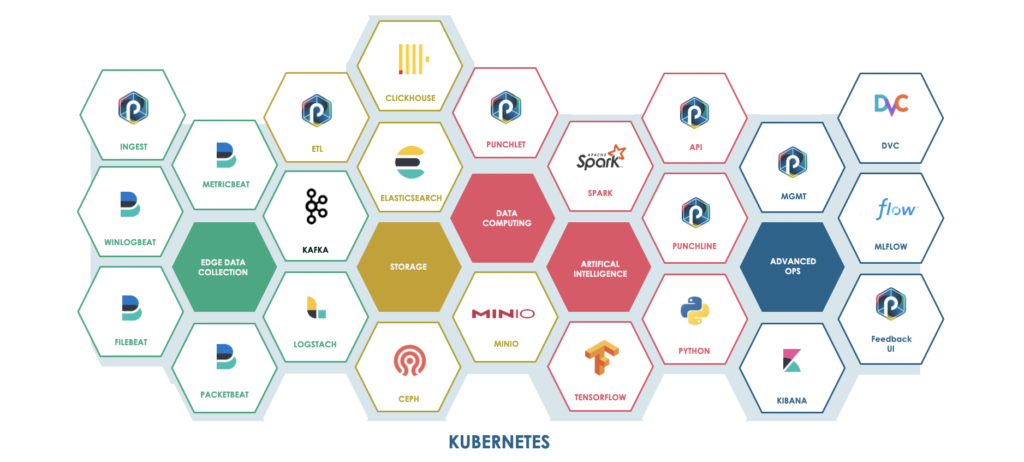
The punch helps to deploy your pipelines using punchlines. Punchlines are graphs of nodes that dramatically simplify your application design. By leveraging the many available input, output, and processing nodes, you have little (sometimes nothing) to code to design and ship your applications to production. You can choose spark, storm, or a punch native runtime.
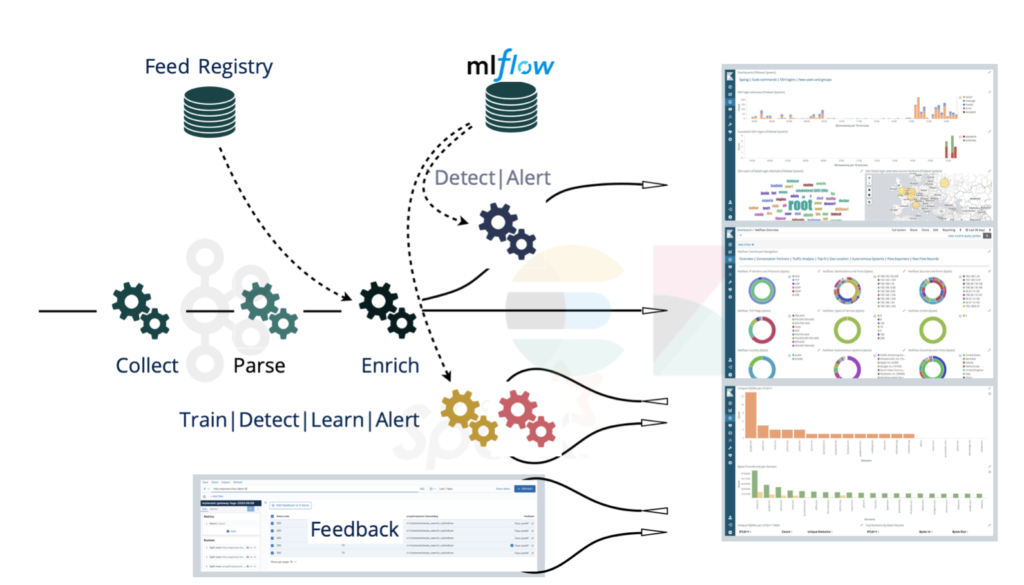
But what about managing and using ML models? The punch was significantly improved. First MlFlow is being integrated. Mlflow brings in several important features. One is to store your models (typically combined with the Punch Minio S3 store) so that they can easily be referenced from a punchline. The punch supports several variants here. For example, you can register your model directly as a spark user-defined-function, and invoke it through a SQL statement. Here is a sketch of how MlFlow fits in the picture.
Another option is to run a mlflow instance serving a given model, just like any other micro-service. Applications can then send their data to that service and be returned with a prediction. This mode is of course less efficient. It works only if you run your prediction on small datasets and/or not too often.
Model Monitoring
Once running, a key capability is to monitor both the performance and the quality of your ML apps. As always the punch produces useful metrics, eventually directed to an Elasticsearch so that you can design monitoring dashboards. But soon enough you need the next piece :
Capturing User Feedback
Capturing user feedback will allow you to recalibrate your models. The punch now provides a great feedback UI, delivered as a Kibana plugin.
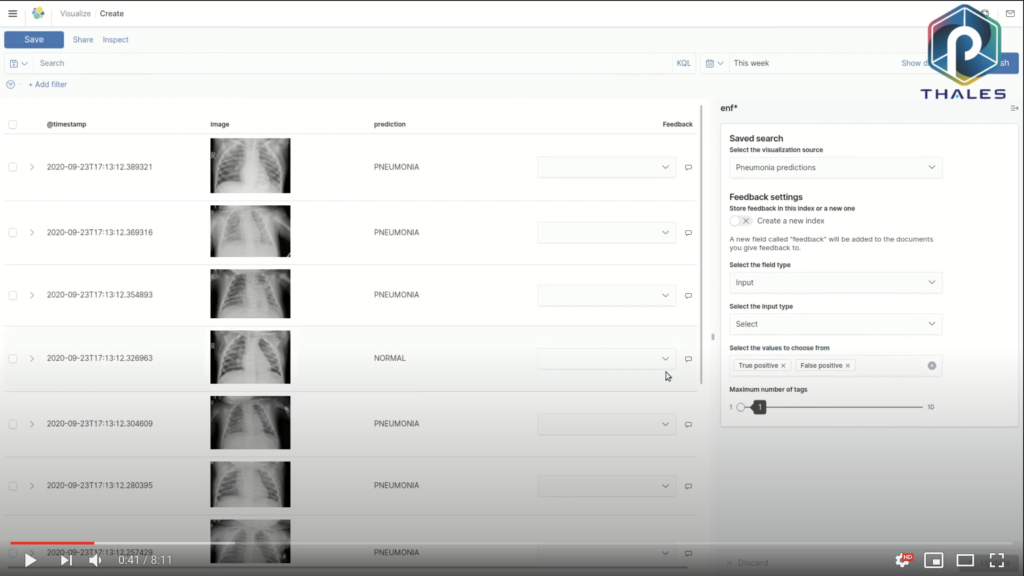
See it in action on the punch youtube channel. That UI is successfully used on various projects and on very different use cases: radar, cybersecurity, or health.
Interestingly, it is designed as a Kibana visualization. It lets your business users provide feedback for one or many items (typically predictions or reported anomalies) at once. That visualization is fully integrated into the secured per-tenant dashboards. In a nutshell, beautiful and ergonomic (leveraging Kibana) and robust and secure (because integrated into the punch).
From Observability to Alerting
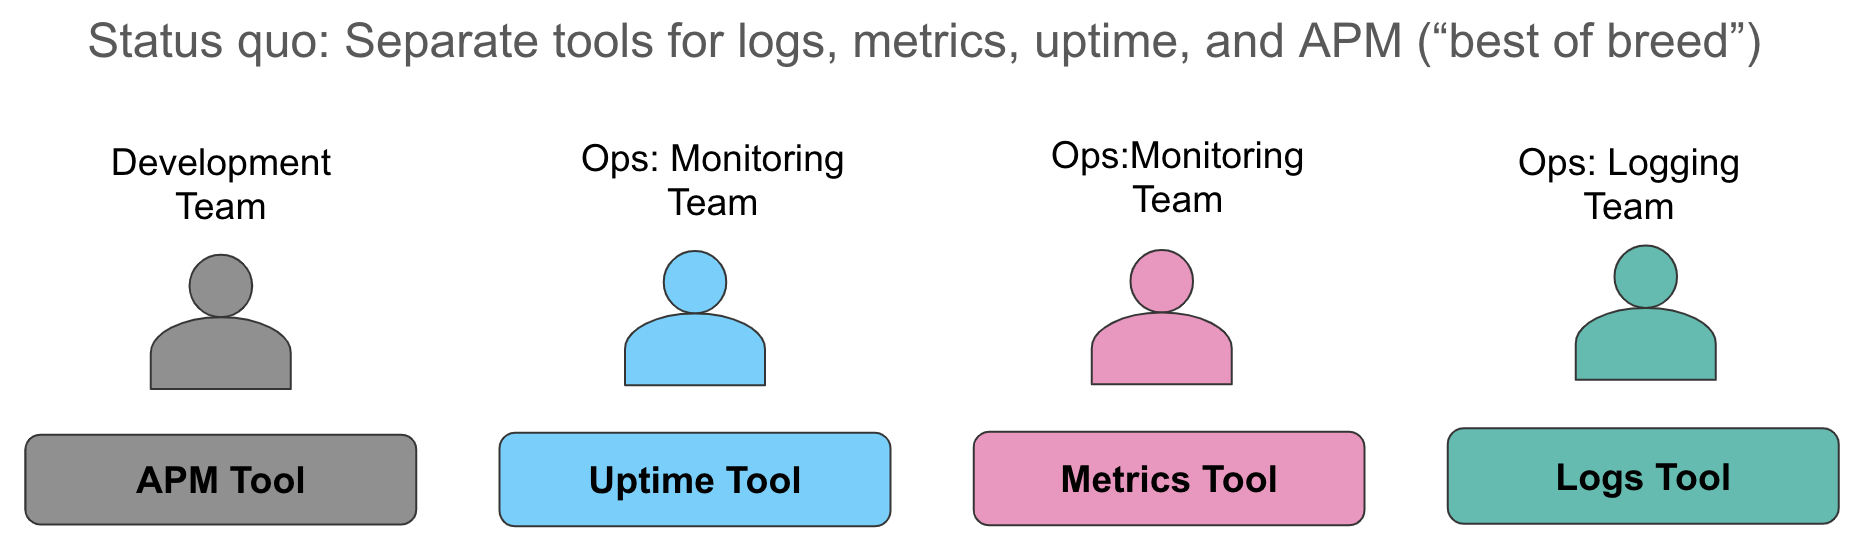
Largely underestimated is the work it takes to make a distributed data processing application observable, monitored, and ultimately notifying you with few useful alerts. There are many tools out there (Prometheus/Grafana, Elastic APM beats ELK, etc). Often a combo is used, this for metrics, that for logs, yet something else for traces.
First note that on the punch, you write and deploy functions deployed as part of graphs (dags). As a result, a lot is monitored for you: traversal time, ack or failure rates, queue sizes, traffic peaks, etc.. That is only a good start, it is not good enough.
We decided early enough (refer to this blog) to assemble our monitoring plane on top and only on top of Elasticsearch, leveraging beats, Kibana, and our own real-time reporting capabilities. This has the benefit of concentrating all metrics, traces, and logs in the same backend, providing end-users with powerful investigation capabilities using a single tool.
In the end, it is easier to learn, manage, operate, and thus cost-effective. Here is that strategy illustrated (courtesy of elastic blog illustrations) :
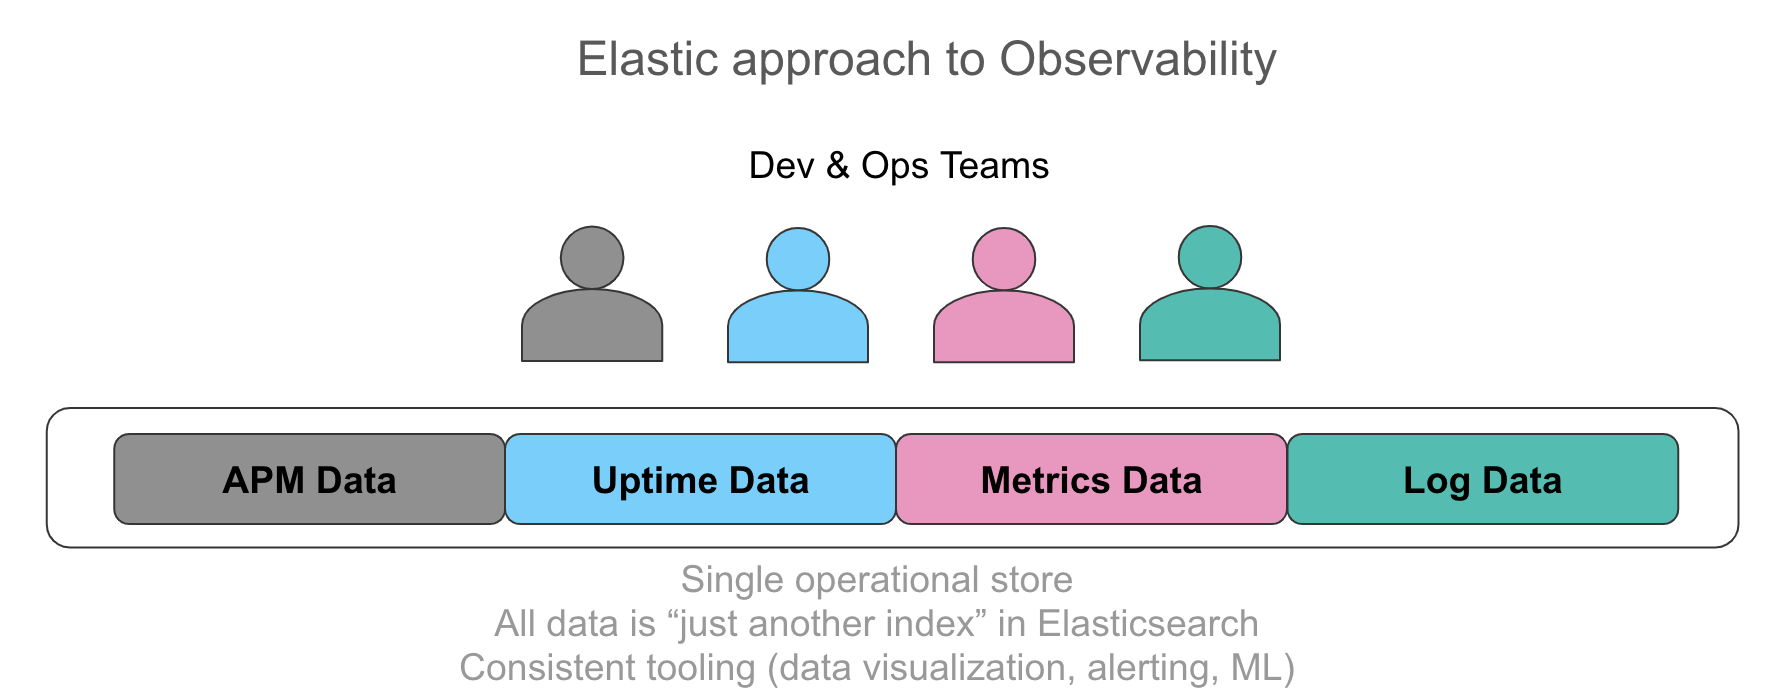
What does it mean? Simply that after you deployed your application onto a punch, you have ready-to-use dashboards for about everything.
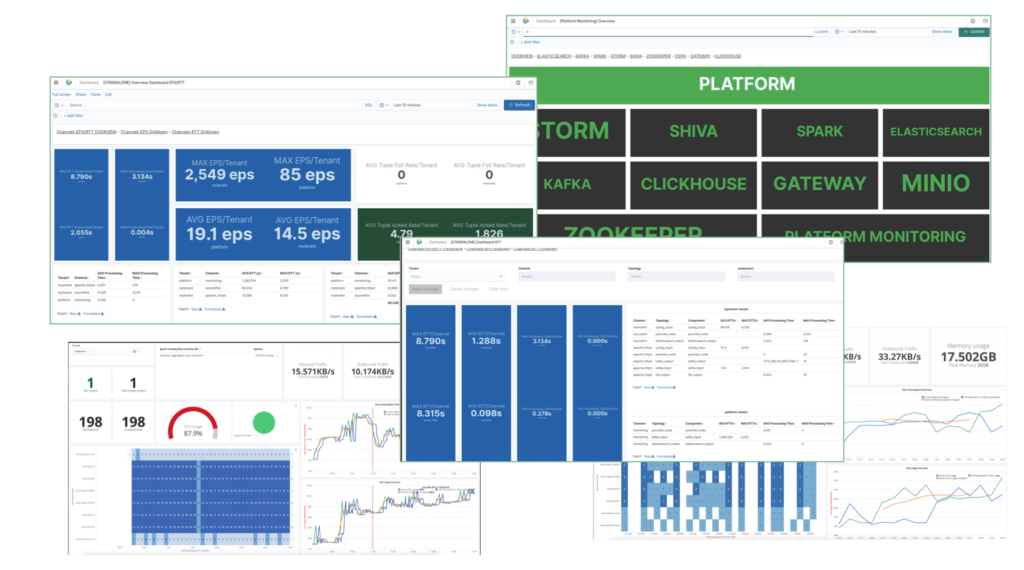
Then comes alerting. The punch fully integrates ElastAlert, available as a per tenant built-in service. In fact, the real hard work is to have all logs metrics and traces normalized (we use the elastic common schema a lot) and stored in Elasticsearch. The punch does that for you. From there, a few ElastAlert rules and .. et voila.
Note that ElastAlert comes in addition to the punch REST API that exposes a consolidated status of your platform. That one corresponds to the black and green dashboard you see in the previous illustration..
Configuration Management
Configuration management is really a hard issue. You need it all: simple and easy to understand for users, yet traceable hence versioned, highly-available and robust, and of course secured. How do you model your application ? where do you store your configuration items? how are they managed? zookeeper? git? Kubernetes/etcd/ConfigMaps? shared filesystems/S3?
Add to the game not only small configurations files but large and/or binary resources (Gb of enrichment data, ML models, etc..) required at startup and often dynamically reloaded at runtime, and there you have it: a hell of a problem to solve. We suggest you go through the state of Kubernetes Configuration Management (from one of ArgoCD contributor) to grasp the challenge in the Kubernetes world.
Here is what it looks like from the user perspective:
I want a stream processing app that will continuously apply the standard (punch) cisco log parser version 4 on logs coming from tenant 2, channel 3. I also need that parser to enrich my logs with the latest real time feeds from my threat intel system. And last I want to apply a prediction algorithm based on Scott model version 6 and view these prediction in a separate dashboard.
(Scott is one of your datascience folk).
(by the way, Scott needs to remember from which dataset was computed his model version 6)
Besides, I would like to run twice a day an aggregation job to compute useful consolidated KPIs, in turn required to provide useful visualisation dashboards to my customer.
(of course all that as part of a tenant)
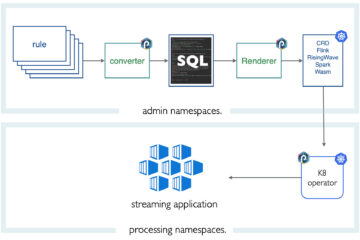
Here is how the punch tackles that challenge. To start with the punch makes you design your complete solution with a few concepts: tenant, channels, applications, and punchlines. In this area, we finally managed to propose a common and simple format to model all data processing jobs: stream, batch, java, or python. If you need to add your processing functions, you ship them as punchline (library) nodes. Hence it stays simple to you.
All these are, in fact, plain JSON or YAML configuration files. That helps a lot, of course, as you think and manage your solution as a simple and well-organized set of plain folders and configuration files. In fact on small or test platforms, you effectively use local folders and files.
On a (real) cybersecurity platform, a punch runs tenths of channels each with several jobs (punchlines), in several tenants. That means hundreds of running entities, each a stream or batch (storm|punch|spark) application, exchanging real-time data through Kafka topics, Elasticsearch, S3, Clickhouse, etc.. Templating comes to the rescue to help generate many similar punchlines and channels. But this said the principle stays identical and users navigate through simple files.
A UI (beta but soon delivered) makes it easy to navigate and view the channels, the punchlines, the parsers, the rules. Here is a preview:
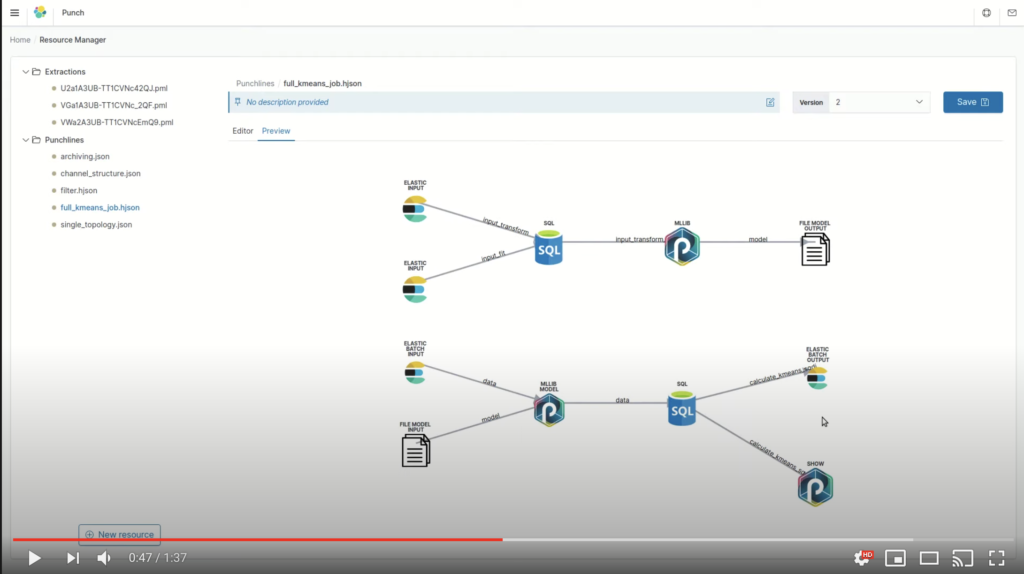
Behind the scene, the punch provides administrators with a lot of power and control but with a minimal set of commands. When an application is started, the processing node(s) where it actually runs are automatically provided with the required configurations. There the punch leverages interesting patterns :
- Kafka is used to distributing configuration data in a way immutable and traced, a very original design that is perfect for both small and large scale platforms. You do not systematically have an S3 store at hand, and anyway, you need immutability and versioning to be robust. You want to precisely know what exactly is running.
- the punch also provides a new resource manager. What this does is to manage the configuration items (parsers, alerting rules, enrichment files, models, etc..) in a registry, along with the required metadata. That resource manager can be configured to store its actual data in an S3 store, in Elasticsearch, or a plain filesystem.
- in turn configuration resources can be manipulated safely using a versioned REST API. The punch also provides a UI to view and manage these resources. You can for example play (i.e. test) a log parser directly from the UI.
- A new resolver feature helps to keep configuration files free of security and destination (source and sinks) details. A very important feature that significantly simplifies application design and testing.
For those familiar with the MLflow model registry, think of the punch resource manager as an equivalent service but not just for ML models. It can store log parsers, alerting rules, enrichment files etc..
This is a rich topic, and hopefully, this short introduction gives some enlightenment. The punch configuration management is designed according to well-known principles. It focuses on providing users with an application-level configuration view while providing admins and ops with powerful yet simple patterns to control the lower-level details.
For more, do not hesitate to visit our online documentation, or to get in touch with us.
Elastic API Gateway
A last interesting new feature is the Punch Gateway API. What this does is to expose the punch Elasticsearch data directly to your customers.
In other words, you (the solution provider), can decide to let the end-users of your punch directly access their elasticsearch data, and of course, only their data, using the standard Elasticsearch API.
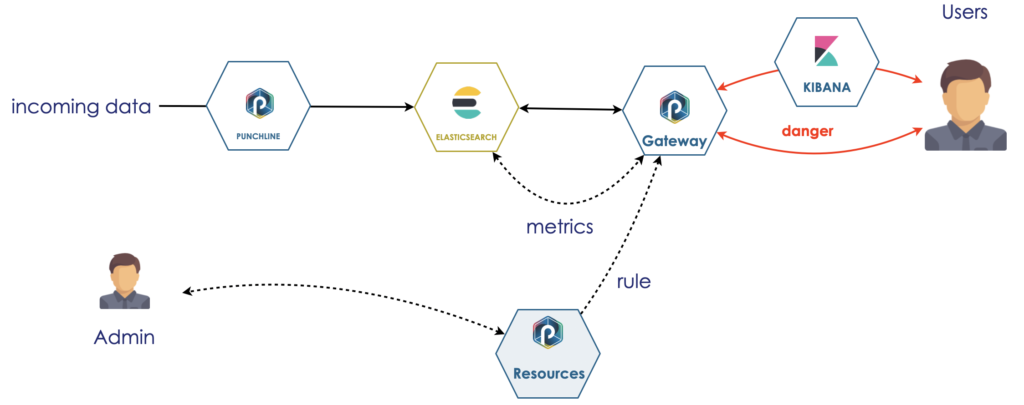
Having such a gateway is nice for obvious security reasons (you know, DMZs). But that is not the only reason. The killer feature is to give you (the solution provider) control to protect your users from performing dangerous requests. Think of denial of service, most often inadvertently.
The punch gateway provides a mechanism to refuse such dangerous incoming requests. You can configure it to take into account both the request itself and the current state of the cluster. Here is what it looks like.
We also work on a variant using an ML service to refine that refusal using a prediction algorithm.
What Next ?
The punch is now a six-year-old technology, fairly old in the ever-changing world of big data and data analytics ecosystem. It keeps progressing with an interesting balance between two tracks:
On one hand, a robust and industrial track where it keeps on equipping new (real) projects for cybersecurity, monitoring, alerting, and data analytics use cases. That track is essential as it makes the punch constantly improve in key industrial areas, not just technical features: support, documentation, update and upgrade, packaging, etc. And yes, the punch must keep on progressing in these areas. The war is not over.
On the other hand, and for the last two years, Thales data science and cyber teams are working jointly with the core punch team to address these hot and complex topics of AI to production: model management, data exploration, user feedback. In fact, as of today, the punch team is really a community. We are all very proud our joint innovation works were granted two internal Thales 2020 gold innovation medals (out of three).
Last, and not least, the punch is now joining a new Thales initiative to go natively Kubernetes. The native punch orchestrator and deployer will seamlessly be replaced by an equivalent Kubernetes stack, designed (in particular) for on-prem and secure environments.
This is such a rich and exciting topic that it deserves a separate blog.
Stay tuned!
A lot of thanks to all teams at play. A big one, of course, to the punch core team for its patient, continuous and intense hard work. Others to teams and users that try the punch, try to see what good can come out of it and contribute. Among these a special thanks to the cyber team, and to Bordeaux and Sofia data science teams. A last special thanks to Claire, that helps us so significantly managing all these folks together with the many punch prospects.


0 Comments