Preamble
We recently upgraded a large platform (several hundreds of virtual servers) from the Avishai punchplatform release to our latest Brad release. In case your read this blog without a clear view of what the punchplatform is, in a nutshell it consists of Kafka, ElasticSearch, Zookeeper, Storm clusters deployed over distributed and secured sites. These platforms run critical 24/24 7/7 cybersecurity log pipelines and monitoring is key. The punch provides many real time metrics, some of them applicative (and even intermixed with the user data so as to capture end to end latency), many others collected using various agents. Nothing really new here, we do just what everyone does to deal with large-scale distributed applications.
Interestingly, the Brad release definitively deprecates Grafana in favor of Kibana for providing the platform monitoring dashboards, and it exclusively relies on beats to monitor server and system resources. Of course, all these beats are automatically deployed by the punch deployer, so as to provide a fully integrated monitoring stack to our customers.
Our Monitoring Journey
Here is a quick recap of our journey with these technologies.
- in 2015 we first started with Grafana and Graphite, using collectd to get the server metrics. We implemented various applicative metrics in our storm topologies so as to send to Graphite kafka offsets, storm acks and the likes, to understand what was going on.
- in 2016 we switched from Graphite to Elasticsearch. Graphite does not scale, and does not provide easy resiliency. More importantly we wanted to leverage the Elasticsearch querying power to have more flexibility designing dashboard. We designed yammer metrics elasticsearch and kafka reporters so as to keep collecting and routing all our metrics to an (ultimate) elasticsearch backend.
- Once equipped with Elasticsearch, we started deploying Metricbeats to replace for the collectds. We started collecting metrics using the now standard scheme tags/name/values.
- in 2017 we decided to start switching to Kibana. Kibana 5 brought in timelion, making it possible to visualise time series, we did not perceived any particular key strength on the Grafana side to motivate maintaining two different tools. The less tools, the better.
- We now use the beats everywhere. And we are now working on a Kibana/Elastic 6 release.
Along the upgrade we had to redesign with our customer his monitoring dashboards. And here we are with a first opinion. Our opinions are of course only our own and completely subjective.
First Impressions
Bottom line : we are more than happy. Kibana is versatile and its querying power makes it possible to not just focus on the usual devops time series views, but instead to compose exactly the views we and the users need to have the right information. And this is the main point we want to emphasise, using Kibana/Elasticsearch we change the way we monitor our platform.
The first key metrics we watched carefully were the Kafka backlogs. Using Grafana we had many views like the following :
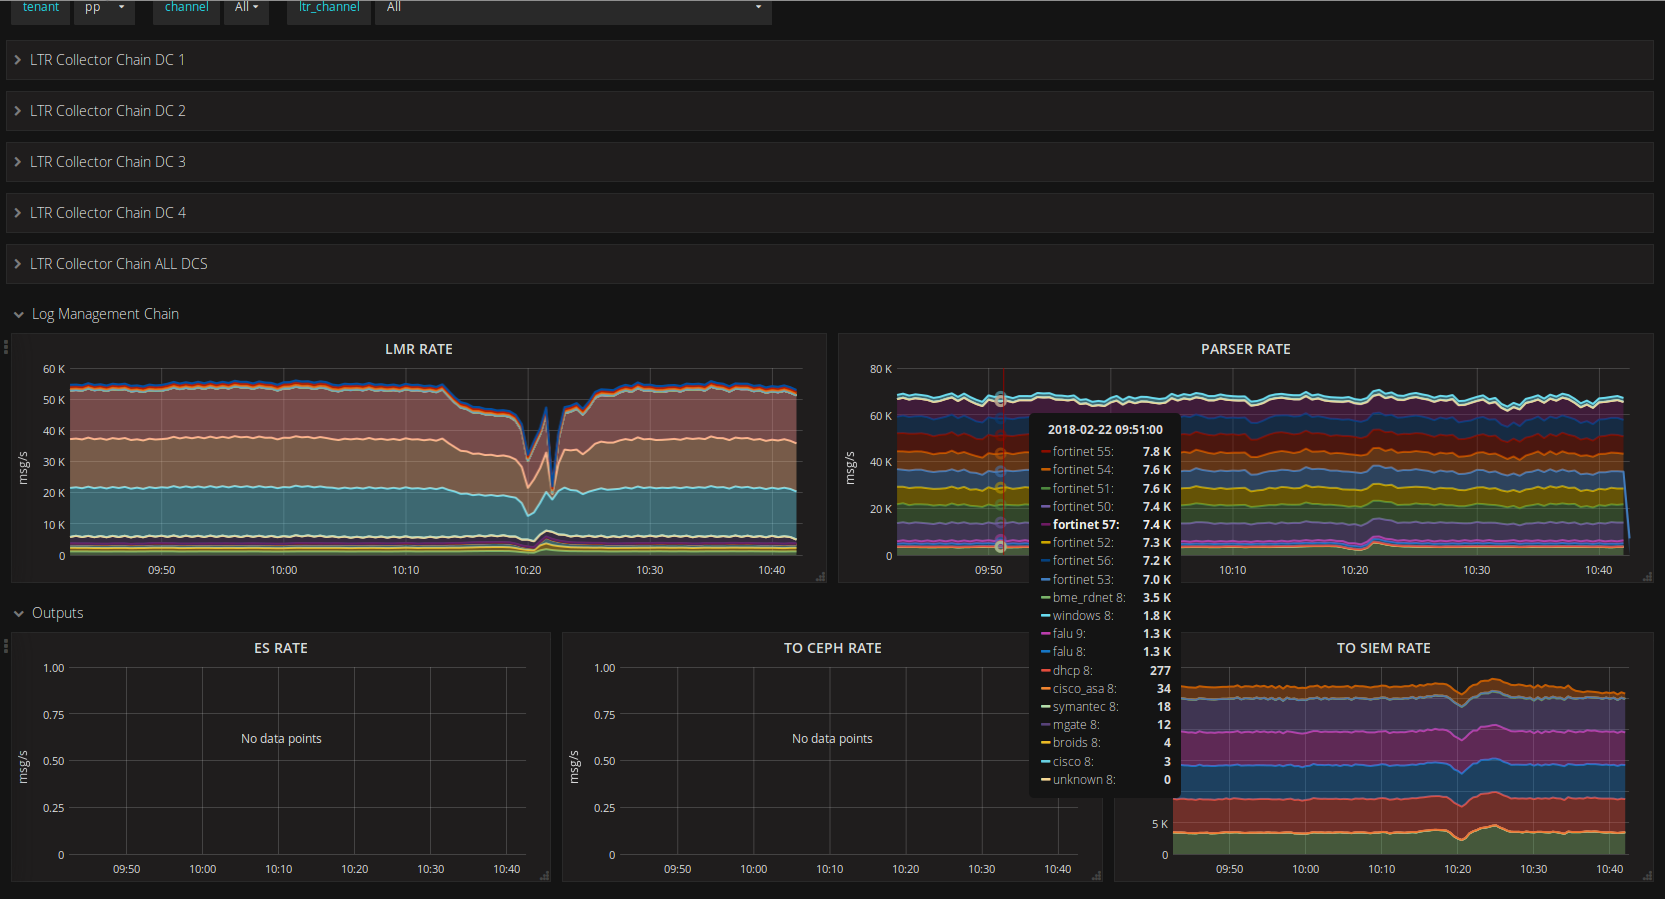
Of course we had similar dashboards with the os and system level metrics. Although we were happy with Grafana at first, we think it is to close to the data : you must really know well your data and designing some useful and concise dashboards, i.e. not just handy but useful, took us quite some time. And at the end they stay too close to the plumbery.
With Kibana, it is a completely different story. The data is there, you can query and visualise it in a number of way. The process to design a dashboard is not lead by the data but by what you are looking at seeing. Here are the dashboards we now use on the production platform.
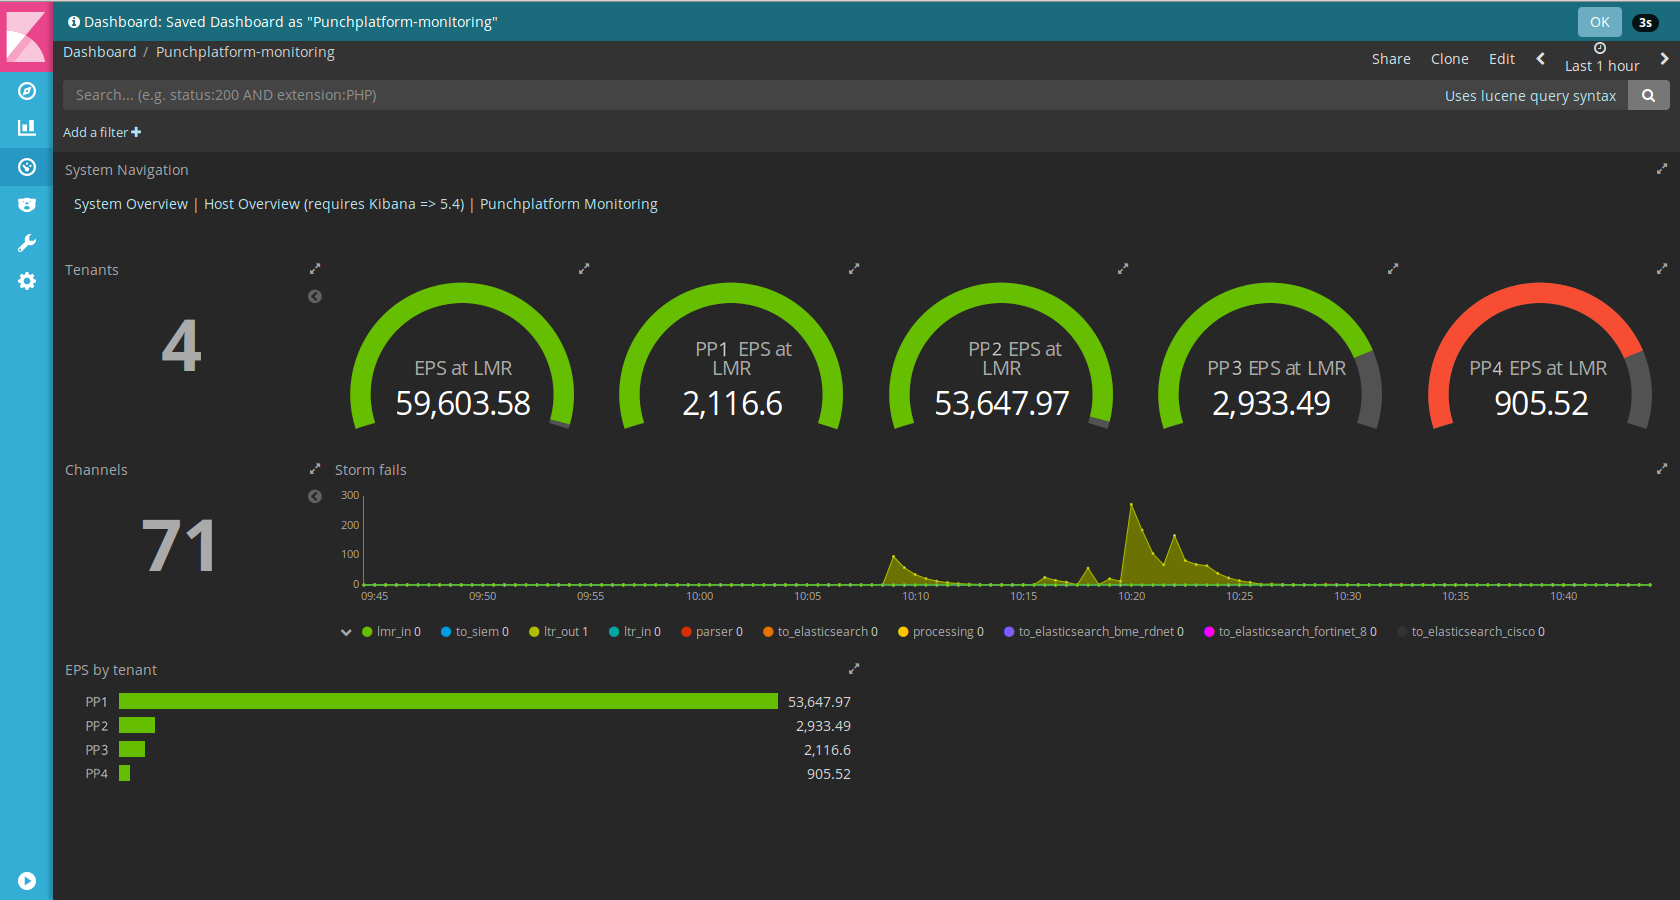
As you can see, these are much more focused on the end-to-end applicative service.What you see is each tenant processing rate (the punchplatform is multi-tenant from A to Z). For example we ended up agreeing that it made more sense to have a consolidated view of the storm failure rate to get a concise view of serious issue. You see some on this picture, actually the platform was in the middle of an upgrade. That kind of view immediately alert our users there are some traffic peaks or some slowing down.
In fact, we do not care too much on visualising disk or cpus over time. We have that data too anyway (metricbeats sends the data, and the metricbeats dashboards are great). The day we need to see that, we have it. It looks like this :
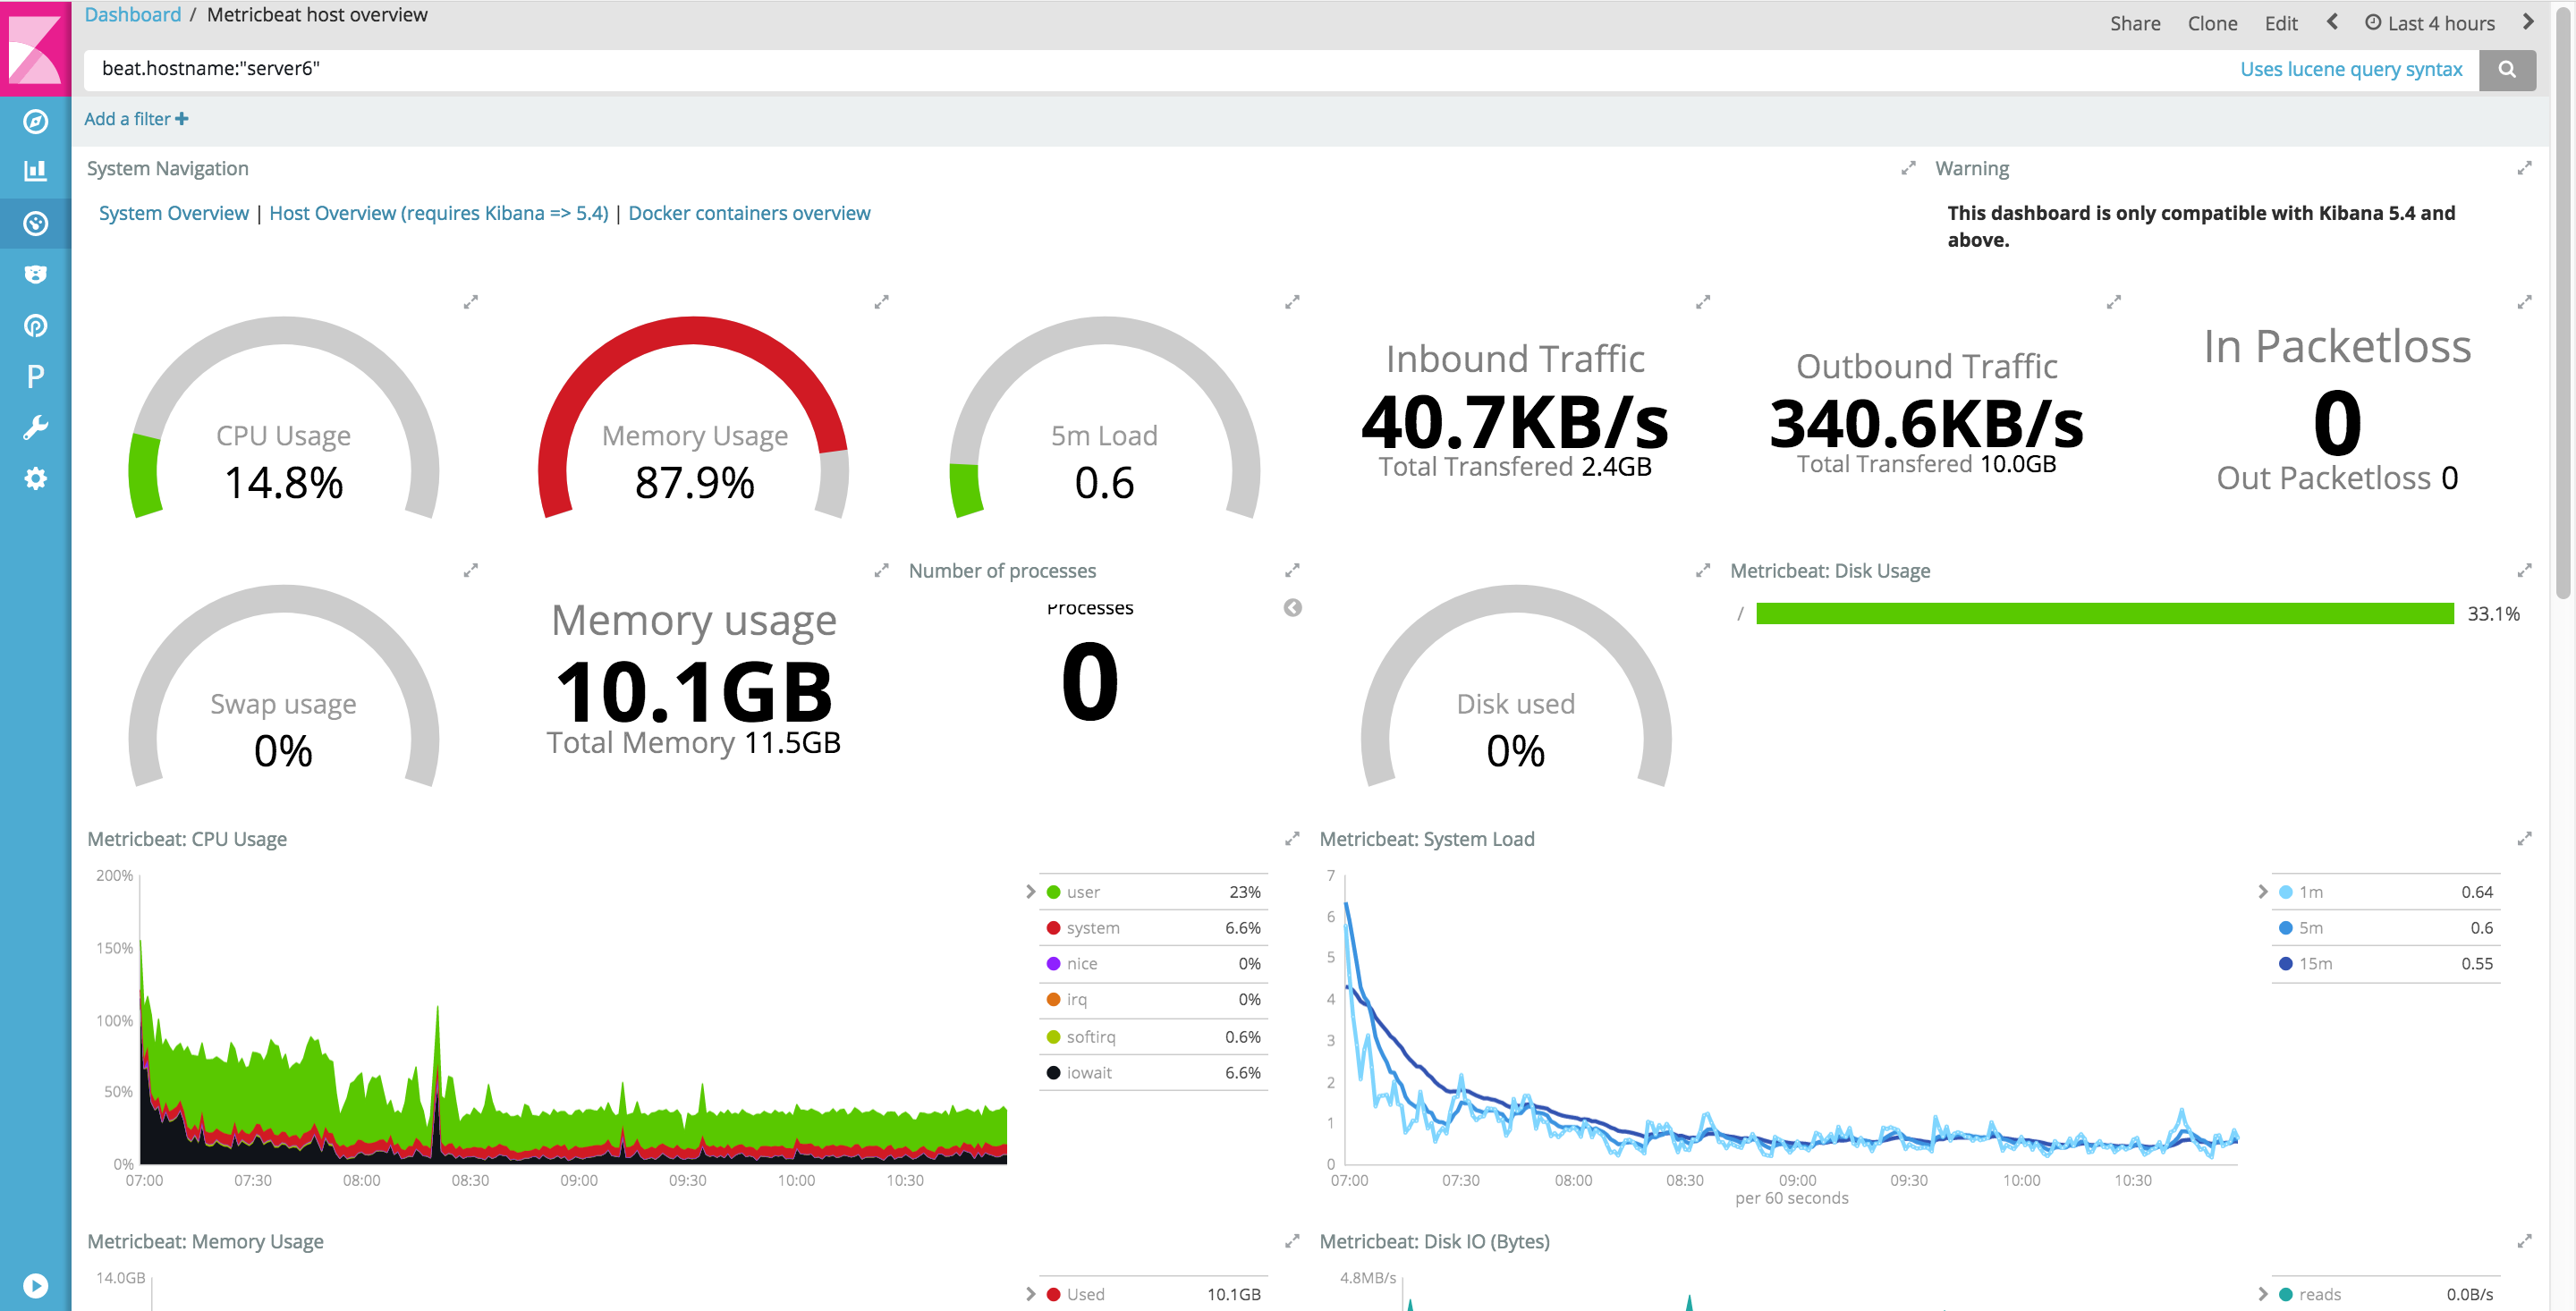
So basically we have it all.
What we now think is that prepackaged monitoring tools make no sense. We work with our customer so that they decide what make sense to visualise. Traditional monitoring systems are left behind anyway, they cannot keep up with the volumetry, with dynamic environments, and with new technologies coming in all the time. This forces all of us to drastically simplify the way we achieve monitoring, and to focus only on the end user services.
Another point worth mentioning is directly related to Elastic querying power. In short, Kibana retrieves less and less data filtered and pre computed by Elasticsearch. At the end the dahsboards are very performant, and you can design powerful aggregations over large time periods. (Not to say that the punch provides additional aggregation capabilities).
Overall we strongly believe you must be able to superimpose several views, often completely different, to get a useful picture of what is going on. Kibana is great in that area. The more it goes the less important it is to have specialised technologies. Just like for geospatial data, Elastic rocks with metrics of all sorts.
Logs + Beats + Punch == Dynamite
A subtle but key point : what we do in the punch is to normalise the data so as to be able to execute arbitrary processing on top of it. We already mix elastic beats data with cybersecurity and applicative logs. Normalising all these data usually takes a few punch lines of code. In turn it makes it both easy and powerful to run machine learning spark pipeline on top of it. Checkout http://kibana.punchplatform.comm to see this in action.
What about Others ?
There are many players in this area. Back in 2016 when getting rid of Graphite we considered using InfluxDb as a replacement. We ruled it out because it is too time-serie and metric oriented, and is not free in clustered mode. Besides it is written in go and exposes a too limited API, we wanted to have all the power of the elasticsearch/lucene API. In addition Elasticsearch is very well integrated with Spark, and we now run Spark pipelines on metric data.
We think it is very important to limit the number of cots at play in a system. One more cots means training people, writing troubleshooting guides, be ready to udate/upgrade it, typically at least once a year, and so on. In contrast having one technology capable of dealing with more than one type of data, not just metrics, immediately gives you a cost killer. This is where Elastic excels.
Conclusion
Grafana is great and helped us a lot. But to our opinion, the momentum around Kibana, Elasticsearch and beats, plus the new features coming in (checkout Canvas and Vega integration) are just overwhelming. We now see the customer projects on top of the punchplatform follow exactly what we described here, they design what they need.
In a next blog post we will elaborate on the new visual capabilities. It is only the beginning.


1 Comment
Punch the 6th - The Punch · October 24, 2020 at 18:59
[…] decided early enough (refer to this blog) to assemble our monitoring plane on top and only on top of Elasticsearch, leveraging beats, […]
Comments are closed.