Punchplatform periodically collects and stores data characterizing the health of the platform (metrics). It gathers both system metrics (CPU, RAM) and applicative metrics like the tuple travel time through a Storm topology.
Since its last version, Punchplatform contains a specific module dedicated to machine learning based on Apache Spark: Punchplatform Machine Learning (check out this PML blog). Using Spark standard machine learning library (mllib) and our sets of metrics, we believe it is possible to develop powerful machine learning models to monitor the health of a platform.
We have integrated machine learning-based platform monitoring into an online Punchplatform and achieved very encouraging results.
Why machine learning ?
By using machine learning, we aim at understanding how different metrics can be used together to extract more information than considering metrics independently.
Because all available metrics are by nature very different (system, applicative), interdependent, and because their behaviors highly depend on context (working hours, week-end), it is tough -if not impossible- to use a few simple rules to achieve efficient monitoring. Even for a specialist, it is tedious to interpret the metrics to have an overview of the platform health.
We strongly believe in machine learning to answer this challenge.
Use Case: Monitoring Livedemo Punchplaform
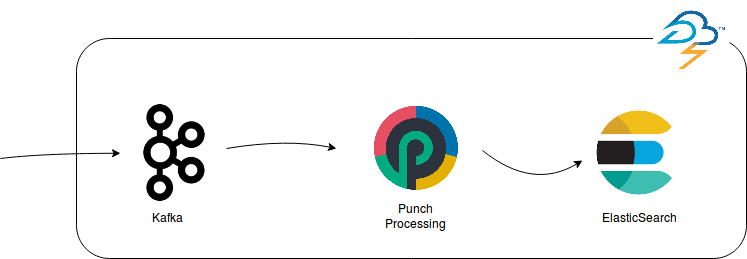
The Punchplatform Livedemo is an online platform that receives data on a TCP socket, stores it temporarily in Kafka, does some processing using punch code and finally indexes it in ElasticSearch. The whole process is integrated into Storm and is easily configured using the standard Punchplatform configuration files.
We have access to these metrics to monitor our system :
- Storm ack rate (Punchplatform)
- Storm failure rate (Punchplatform)
- Kafka backlog (Punchplatform)
- Load (metricbeat)
- RAM (metricbeat)
- Storm topology uptime (Punchplatform)
As a side note, the punchplatform ships in with many metrics like these to make it easy to monitored distributed and scalable applications. In particular the last mentioned metric, the uptime metrics, is one that let us detect the restart of a Storm worker.
To try out machine learning on such monitoring use case, we arbitrarily decided that we want to detect every topology restart. In other words, every time the topology uptime goes down to 0. This is a good starting point as a restart usually comes with a brief service interruption and a potential data loss.
Our dataset consists of 36 hours of standard live-demo running. The following Kibana dashboard highlights the evolution of each studied metric. Notice in particular that a crash occurred on June 24th, 7:30AM.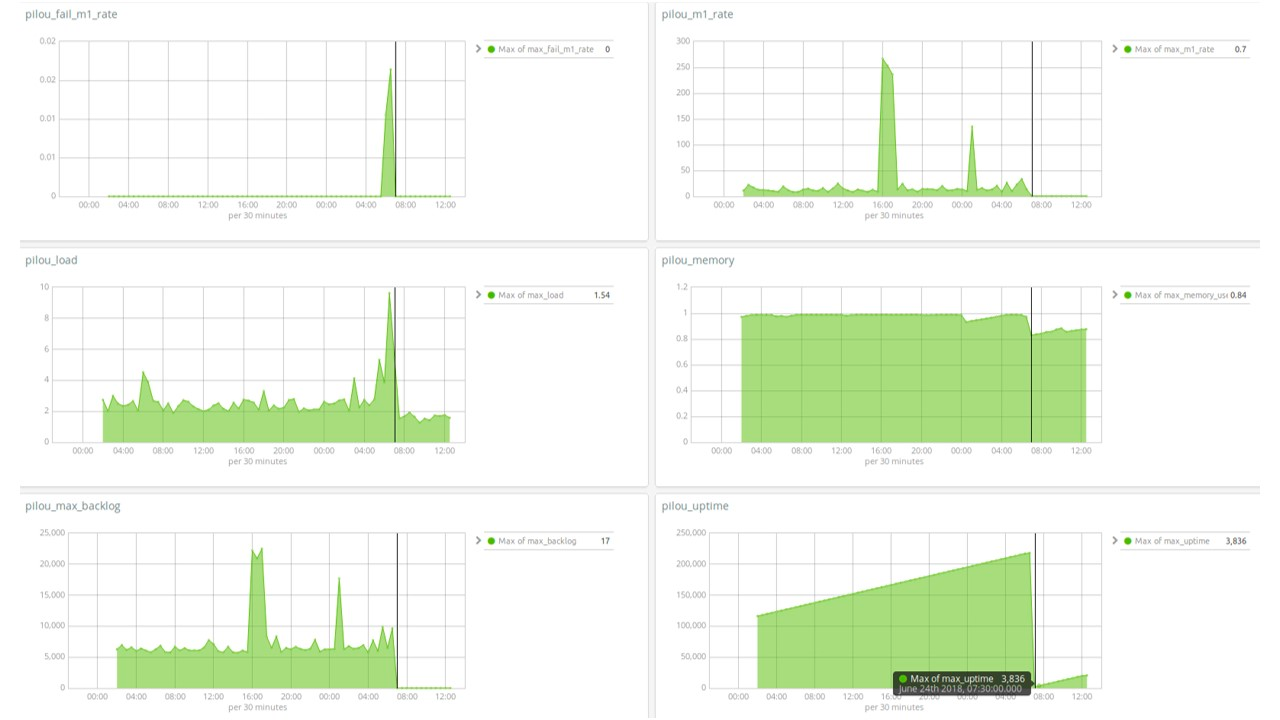
Detecting standard patterns with machine learning
We trained an unsupervised (clustering) machine learning algorithm and assigned a cluster to each data point. By doing so, we generated 5 distinct clusters and afterward tried to interpret our results by associating a “platform behavior” to every cluster.
Let us draw a 2D-projection of our cluster, only to informally visualize the data repartition :
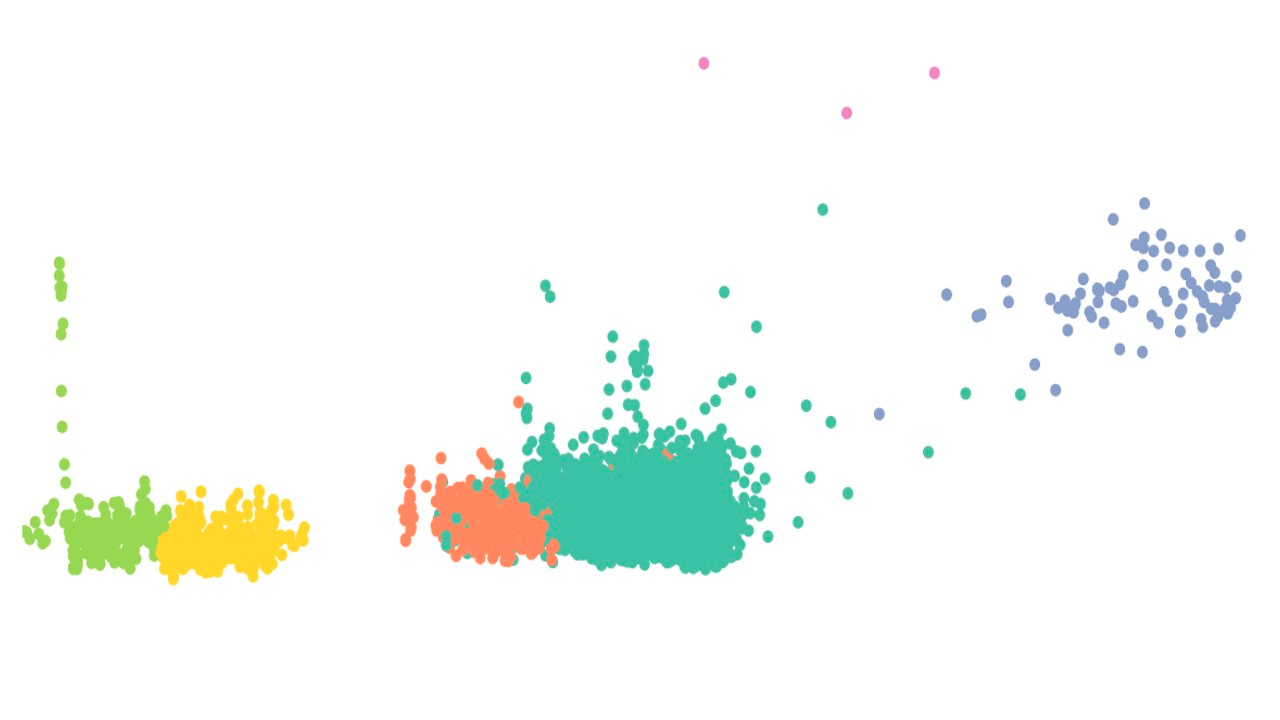
The temporal repartition of our different clusters is the key point that links our different clusters to the tracked uptime metric. What was astonishing at first view was that the data points after the crash all belong to the same cluster, meaning that the global behavior of our metrics is fundamentally different before and after the crash.
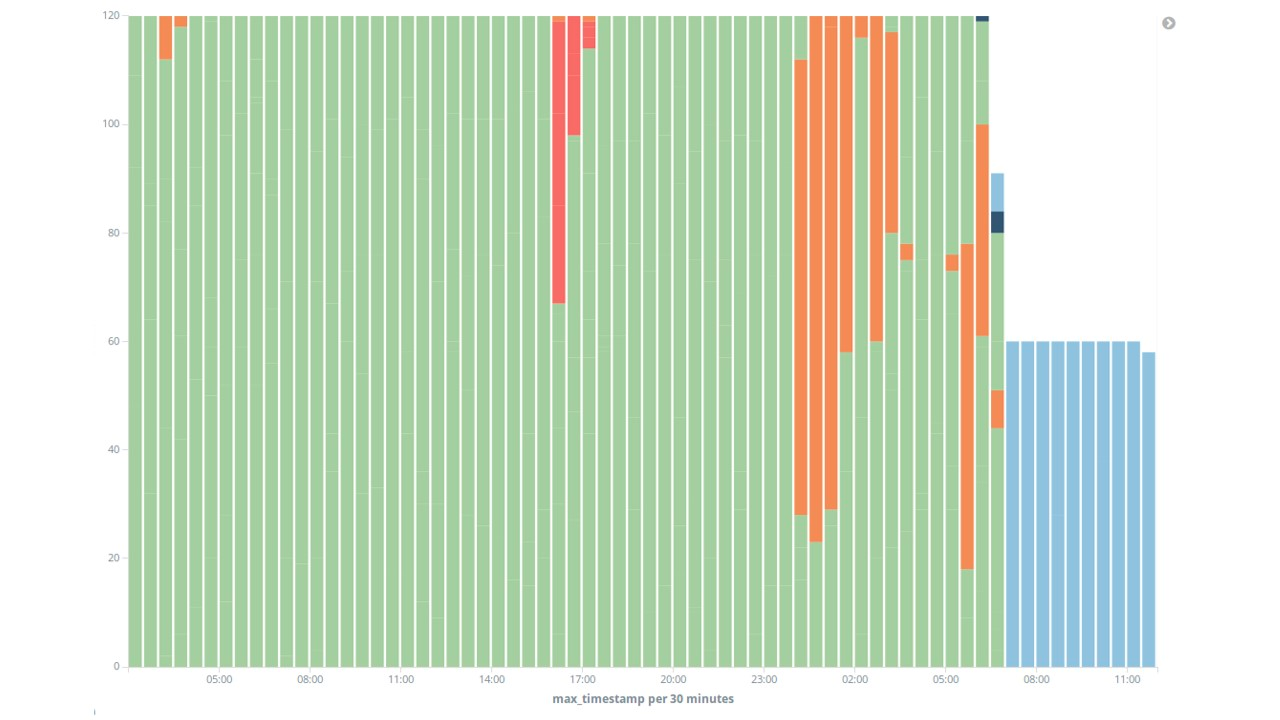
Given the evolution of all our metrics on the period (viewable in the Kibana Dashboard), we can give an interpretation of each cluster :
- The green cluster corresponds to a standard state of the platform where everything is working fine
- The red cluster corresponds to data points that have an unnatural elevated kafka backlog
- The orange cluster may correspond to a state where some metrics indicate that the system is overloaded.
- The black (dark blue, you got me on this one) cluster corresponds to a crash (topology restarts)
- The blue cluster corresponds to a restart after the crash
Conclusion
The results obtained from our simple machine learning algorithm seems highly correlated to what we call “platform health status”.
In our case tracking the reset of our uptime metric is a far more efficient solution than using machine learning algorithm, but setting up this process proved the reliability of the method for more complex problematics and more advanced needs.
A deeper investigation is obviously necessary to fully validate the protocol, as our model and results have not been confronted to new datasets, but this is a very first step to show how promising machine learning can be when it comes to monitoring a system.